Product

From signal to decision in one loop.

Five instruments. One operating surface. Built for supply-chain teams who need to act before disruption reaches operations.

Source-linked evidence · human-reviewed actions · SSO / SAML and audit trail on Enterprise Graph
Risk Radar · 1,284 suppliers tracked
Live
Supplier watchlist
5 shown
  • 82
    Hailong Components
    CN · Shenzhen
    critical
  • 68
    Meridian Logistics
    NL · Rotterdam
    high
  • 54
    Astra Polymers
    DE · Düsseldorf
    medium
  • 41
    Brakeford Steel
    PL · Katowice
    medium
  • 22
    Coral Bay Foods
    VN · Hai Phong
    low
Risk map · global
3 incidents
Lane RTM → CNSHA · 8d ago
Alert queue
  • critical12 min
    Yantian congestion
    PO-78291 · Ocean
  • high2h
    Supplier score drop
    Hailong · -14 pts
  • medium8h
    Weather window closing
    Lane RTM → CNSHA
Network risk score · 30d
61 ▲ 7
Recommendation
Reroute via Singapore · 86% impact reduction
Affects PO-78291 · ETA shift +2 days · cost delta +$48k
Apply
The loop

Map · Monitor · Predict · Simulate · Act.

  1. Step 01
    Map

    Multi-tier supplier graph from your ERP, BOMs, and POs.

  2. Step 02
    Monitor

    24+ live signals — weather, ports, sanctions, financial, news.

  3. Step 03
    Predict

    Forecast supplier delays, ETA risk, and SKU stockouts.

  4. Step 04
    Simulate

    60-day stress tests on demand, routes, and supplier outages.

  5. Step 05
    Act

    Recommended backups, pre-builds, and weekly executive briefs.

The modules

Each module connects input → signal → decision.

Supplier Risk Graph

See Tier-2 and Tier-3 dependencies before they hurt.

82
Risk score
Live · updated 4m ago
Input
ERP suppliers, BOMs, PO history, qualified backups.
Signal
Supplier financial health, ownership changes, single-source paths.
Decision
Open backup qualification, shift volume, escalate sourcing review.
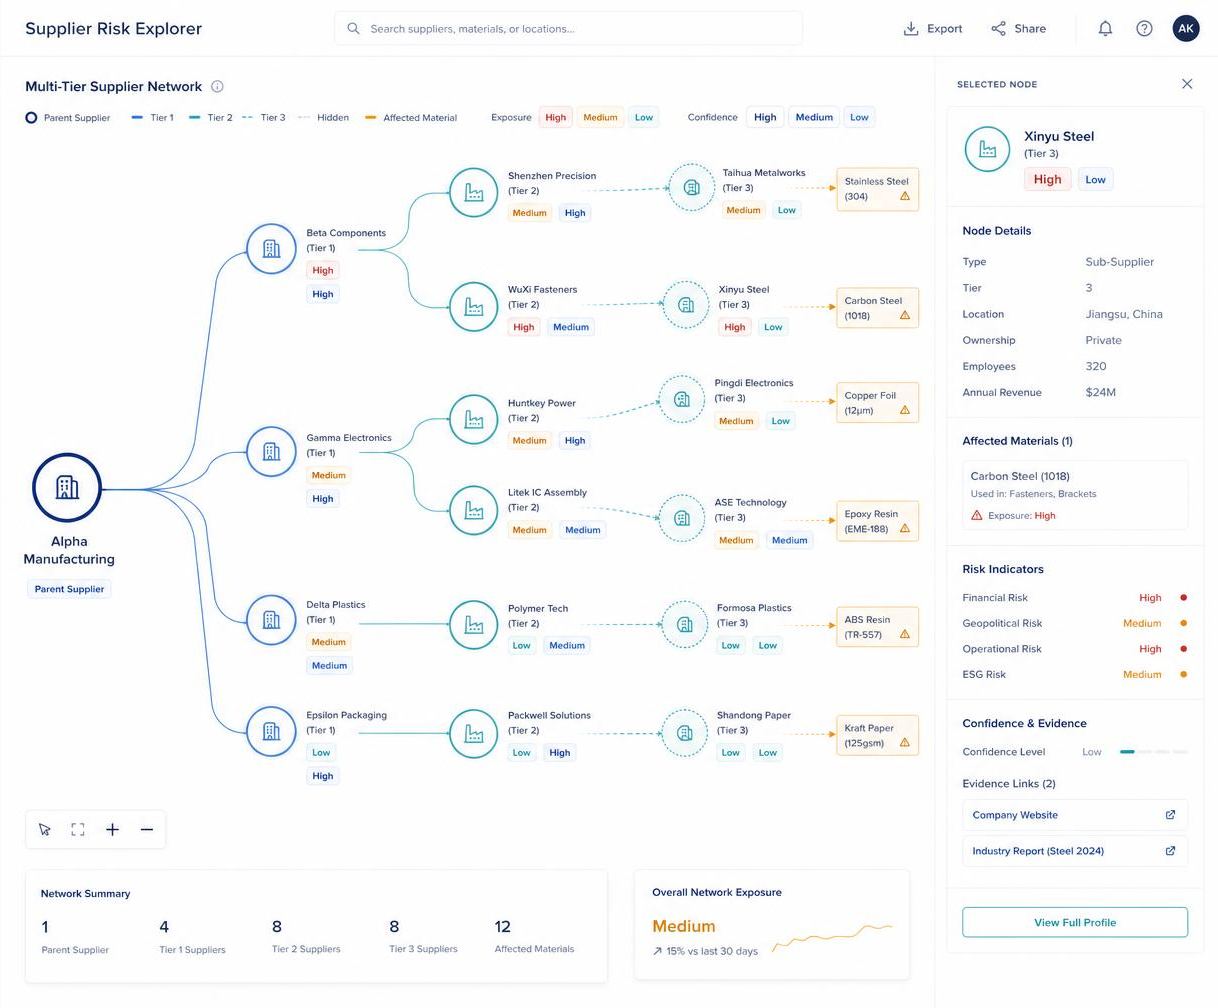
Dependency map showing a parent supplier traced through tier-2 and tier-3 sub-suppliers to affected materials, with exposure states, confidence labels and evidence links
Disruption Radar

Only the signals that actually touch your network.

ETA exposure · 30d+6.2d
Input
Weather, ports, sanctions, carrier dwell, regional news.
Signal
Severity & confidence per supplier, lane, and SKU.
Decision
Reroute, expedite, notify customer ops with one click.
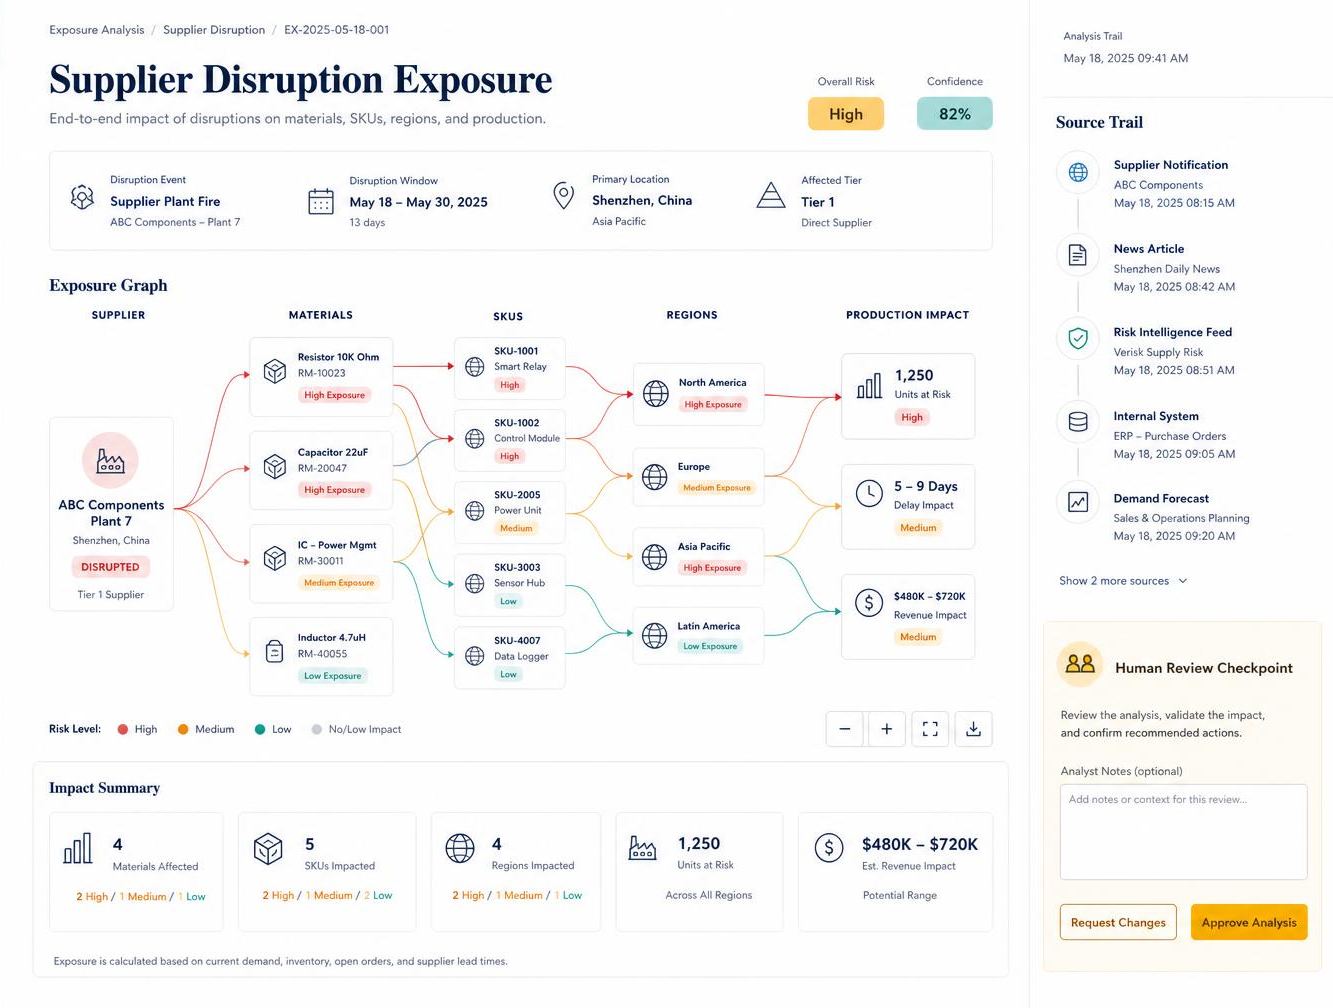
Exposure graph linking a disrupted supplier to affected materials, SKUs, regions and production impact, with a source trail and human review checkpoint
ETA Risk Forecast

Probability-weighted ETAs with action thresholds.

Lane RTM → CNSHA
Watch
Input
TMS feeds, carrier scorecards, lane history, port dwell.
Signal
Shipment-level delay probability and exposure in days & dollars.
Decision
Trigger expedites, pre-position safety stock, alert promised dates.
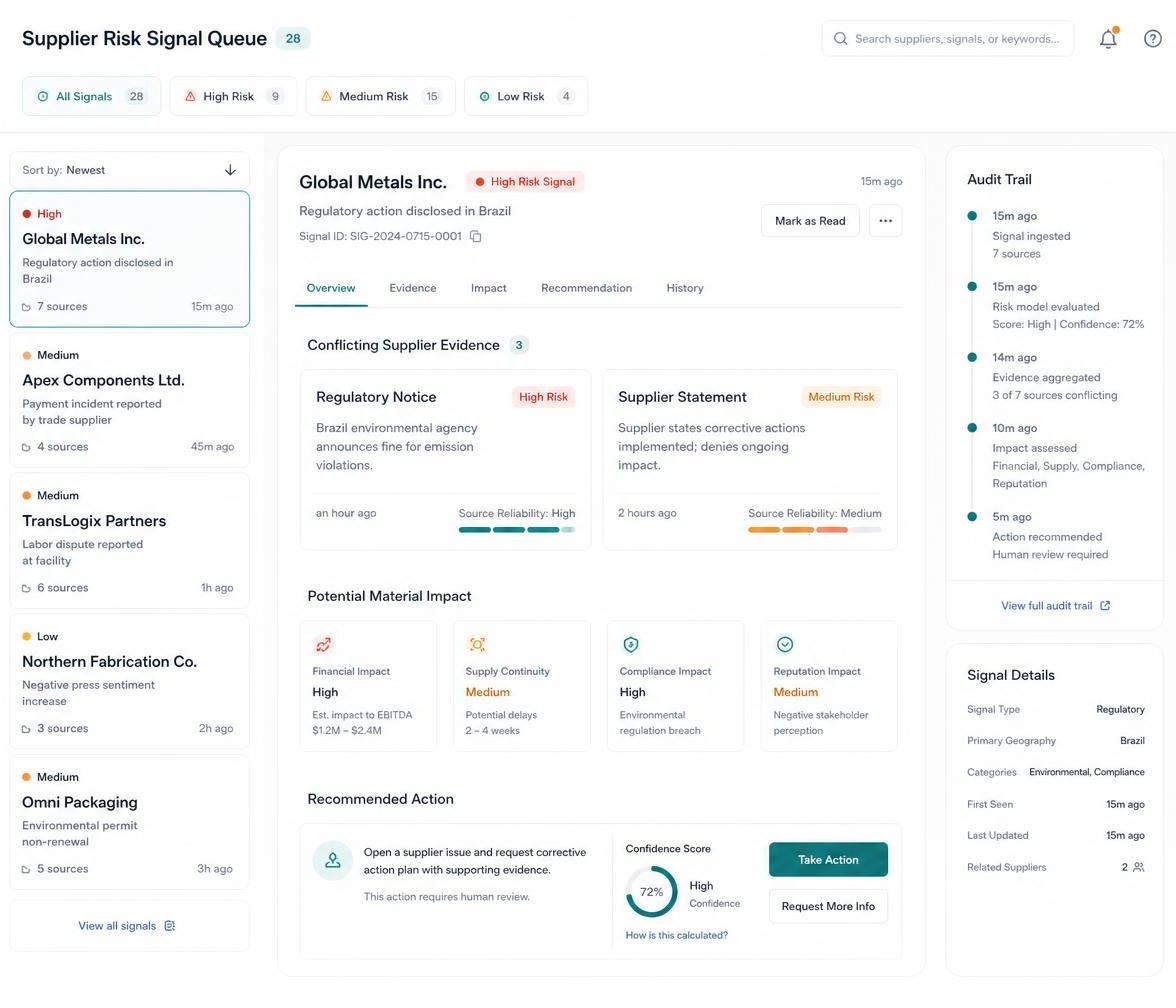
Signal queue of incoming supplier-risk source records with conflicting evidence, material impact, confidence score and a recommended action awaiting human review
Inventory Stress Test

60-day burn-down against five real disruption scenarios.

41
Risk score
Live · updated 4m ago
Input
Cover days by SKU, demand forecast, inbound exposure.
Signal
When safety stock breaches — and which SKUs go red first.
Decision
Pre-buy, reallocate across DCs, hedge against the next quarter.
Compliance Visibility

Documents, certifications, and sanctions exposure tracked.

ETA exposure · 30d+6.2d
Input
Supplier docs, country exposure, sanctions lists, audit cycles.
Signal
Expiring documents, restricted jurisdictions, audit gaps.
Decision
Flag exposed lanes, route around restricted countries.
Weekly Supply Brief

Analyst-grade summary for leadership — what changed, what to do.

Lane RTM → CNSHA
Watch
Input
All of the above, ranked by impact and confidence.
Signal
Top exposures, week-over-week deltas, what was acted on.
Decision
Brief operations, procurement, and the board in one shared page.
Sub-tier exposure in practice

One automotive network, 11 days to under 4 hours.

Tier 1 Automotive Components Manufacturer (EMEA Region)

Anonymized per NDA. Company name and logo withheld.

Sector
Automotive Tier 1
Annual revenue
€2.1B
Manufacturing sites
14
The invisibility of our sub-tier network was a systemic risk we couldn't quantify. TierTrace didn't replace our sourcing team, but it eliminated the two-week lag in identifying where our actual exposure lived during the Q1 logistics bottlenecks.
Alistair Vaughn, VP of Global Procurement
Users

Strategic Sourcing Manager, Global Risk Lead, and four Procurement Analysts.

Before TierTrace

Quarterly Excel supplier surveys, PDF contract dependency tracking, and anecdotal supplier communication.

Use case

Mapping tier-2 and tier-3 dependencies for critical semiconductor and resin feedstock to identify single-source vulnerabilities.

Inputs

SAP S/4HANA ERP export, BOM dumps, and third-party shipment signal feeds.

Baseline

Identifying a tier-3 failure took 11 business days on average, from event occurrence to impact assessment.

Current state

Dependency mapping reduced Time-to-Awareness for tier-3 disruptions to under 4 hours.

Operating window

March 12, 2025 — present

Methodology

Timestamp comparison between external signal ingestion and internal risk-flag generation.

Integrations

Read what you already have, write almost nothing back.

SAP S/4HANA

Relationship
Live direct REST API via connector.
Data in
Material Master Data, Approved Vendor List, Purchase Order history.
Data out
Risk scores as metadata only, dependency flag status.
Permissions
Read-only access to procurement modules. Write access restricted to custom Risk-Tag fields.
Fallback
CSV/XLSX batch upload via secure SFTP.

Project44 / FourKites

Relationship
Live direct API via webhooks.
Data in
Shipment signals, port delays, carrier transit status.
Data out
None.
Permissions
Read-only shipment tracking.
Fallback
Manual signal input.

Integration descriptions reflect technical connectivity only. TierTrace claims no formal partnership, certification, or co-marketing relationship with these vendors.

Authority boundary

TierTrace maps and recommends. People decide.

TierTrace automates
  • · Risk scoring
  • · Dependency linkage
  • · Signal correlation
Human required
  • · Supplier substitution
  • · Purchase-order cancellation
  • · Risk mitigation approval

TierTrace may map dependencies, connect signals to materials and SKUs, prepare risk views, and suggest review actions.

TierTrace does not automatically replace suppliers, reroute shipments, approve purchase orders, certify compliance, or guarantee discovery of every hidden dependency.

Human review is required for supplier changes, procurement actions, compliance decisions, and external notifications.

Users may manually override risk scores. Every override is logged with a required reason code and timestamp.

Get started

See your supplier risk in one screen.

Start with a guided dependency map before expanding to a full supplier graph.